All categories
Featured selections
Trade Assurance
Buyer Central
Help Center
Get the app
Become a supplier
Easy-to-Operate School Library POS ERP App Win DOS Mobile Software
Business
Online Shopping Store Inventory Software Shipping
$15
Min. Order: 12 units
Alibaba
Consumer Electronics
Computer Hardware & Software
Software
Data reporting business intelligence
(936 products available)
Previous slide
Next slide
Easy-to-Operate School Library POS ERP App Win DOS Mobile Software
Business
Online Shopping Store Inventory Software Shipping
$15
Min. Order: 12 units
Previous slide
Next slide
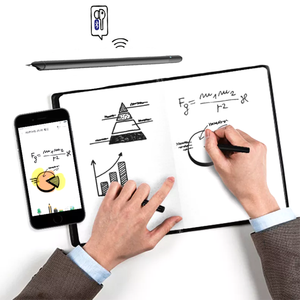
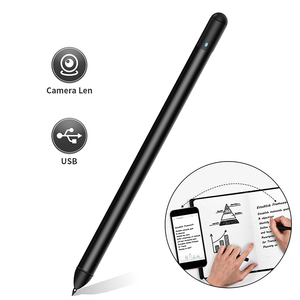
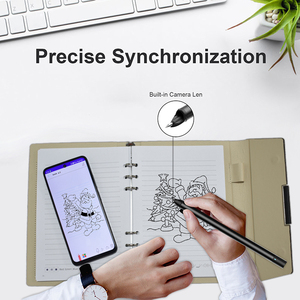
Electronic Smart AI Draw Sync Pen Cloud Storage Wireless Digital Notebook Smart Pen Paper AI Drawing Writing Notepad With App
Ready to Ship
$4-50.73
$4.50-57
-11%
Shipping per piece: $17.45
Min. Order: 1 piece
Previous slide
Next slide
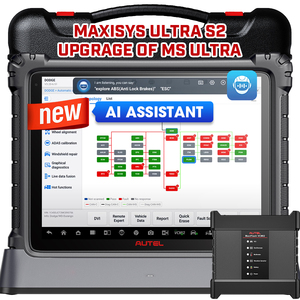
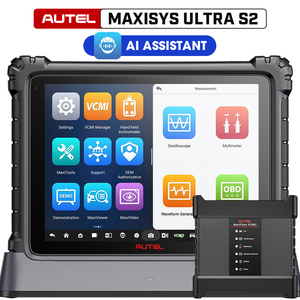
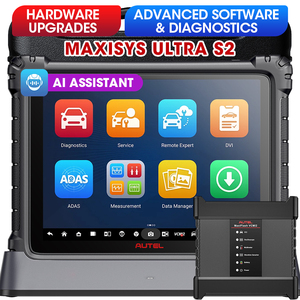
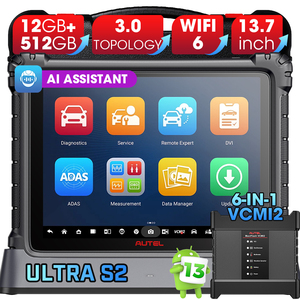
Autel MaxiSys Ultra S2 Scanner With AI ECU 6-in-1 VCMI2 Topology 3.0 Up Of MS Ultra MS919 Top
Intelligent
Scan Diagnostic Tool
$4,699
Min. Order: 1 set
Previous slide
Next slide
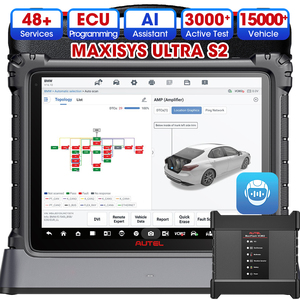
Autel Ultra S2 AI Assistant Large Screen Touch Control High-definition Display One-click Programming Car Diagnostic Tool
$4,699
Min. Order: 1 set
Previous slide
Next slide
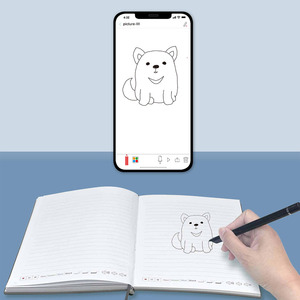
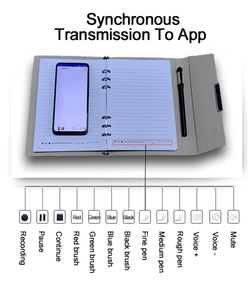
Digital Cloud Storage Paper Screen Synchronized Handwriting Recognition Smart Pen And Notebook Writing Set
Ready to Ship
$35.30-57
Shipping per piece: $16.70
Min. Order: 1 piece
Previous slide
Next slide
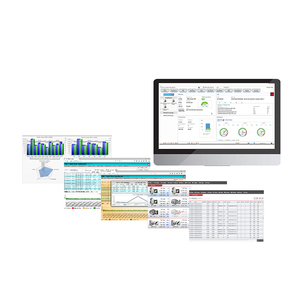
All-in-One ERP Software with Real-Time
Reporting
, Workflow Automation, and Smarter
Business
Insights to Drive
Business
Growth
$95
Min. Order: 1 piece
Previous slide
Next slide
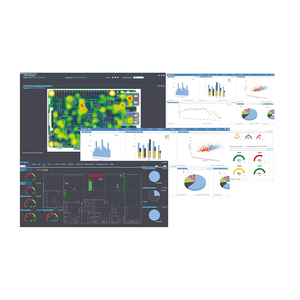
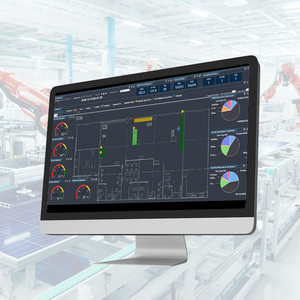
High Tech Smart
Business
Intelligence
(BI) I4.0 System Platform Solutions Provide Operation
Reports
and Smart Dashboards
$8,000-70,000
Min. Order: 1 unit
Previous slide
Next slide
AI-Driven Customer Analysis &
Reporting
System for Corporate Official Websites
$999
Min. Order: 1 piece
1
2
3
4
5
More pages
24
Top categories
Camera, Photo & Accessories
Used Electronics
Television, Home Audio, Video & Accessories
Cables & Commonly Used Accessories
Computer Hardware & Software
Mobile Phone & Accessories
Projectors & Presentation Equipments
Mobile Phone & Computer Repair Parts
Other Consumer Electronics
Chargers, Batteries & Power Supplies
Video Games & Accessories
Portable Audio, Video & Accessories
Electronic Publications
VR, AR, MR Hardware & Software
Earphone & Headphone & Accessories
Speakers & Accessories
Previous slide
Next slide
Related Searches:
passport skin


 Ready to Ship


 Ready to Ship