All categories
Featured selections
Trade Assurance
Buyer Central
Help Center
Get the app
Become a supplier
Alibaba
Packaging & Printing
Packaging & Printing Services
Paper & Paperboard Printing
Classical chart
(3500 products available)
Previous slide
Next slide
Rustic Tin Signs
Classic
Beer Metal Sign Man Cave Bar Pub Club Wall Decor Vintage Metal Poster Wholesales Custom
$0.50-2
Min. Order: 50 pieces
Previous slide
Next slide
Chic Decoration Faux Books Set for Stylish Home Decor Modern Customized Fake Book
Ready to Ship
$0.33-0.99
Shipping per piece: $54.59
Min. Order: 50 pieces
Previous slide
Next slide
Plastic Stone Sample Product Catalogue Display Book Sample Booklet High-quality Thickened Cardboard Sample Display Book
$0.79-1
Min. Order: 100 pieces
Previous slide
Next slide
Custom Movie Vintage Tin Sign Metal Poster Plaque Vintage Film Tin Sign Wall Decor For Man Cave Bar Pub Club
$0.50-1.50
Min. Order: 2 pieces
Previous slide
Next slide
High Quality Manually Sun Moon Earth Model of Educational Equipment Three Globe Model
$8.20-12
Min. Order: 50 sets
Previous slide
Next slide
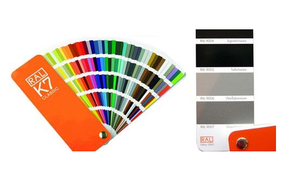
Cheap Ral K5/K7
Classical
Color
Chart
Colour
Chart
$55-60
Min. Order: 5 pieces
Previous slide
Next slide
Kindergarten Classroom
Classic
Learning Activity
Charts
Early Educational Posters 220 Sight Words Cards
$0.68-0.85
Min. Order: 100 sets
Previous slide
Next slide
RAL K7
Classic
Paint Color
Charts
Page Chip Card Brochure
$16.77
Min. Order: 10 pieces
1
2
3
4
5
More pages
88
Top categories
Packaging & Printing Services
Paper Packaging
Packaging Auxiliary Materials
Plastic Packaging
Textile Packaging
Printing Materials
Logistics Packaging
Other Packaging & Printing Products
Glass Packaging
Packaging Raw Materials
Pharmaceutical Packaging
Metal Packaging
Wooden & Bamboo Packaging
Previous slide
Next slide